Feed Industry
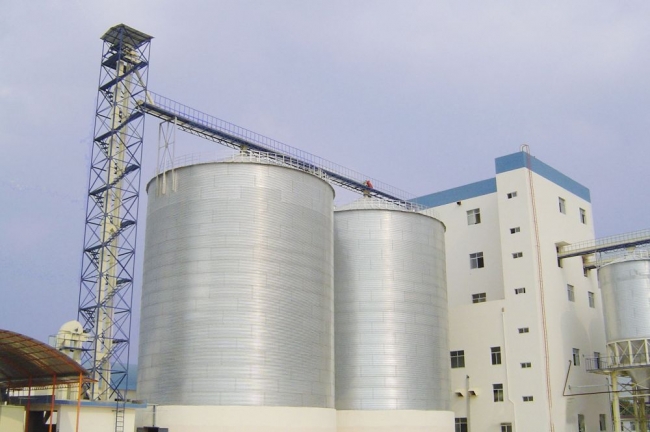
PREAMBLE
Bangladesh has a unique, hi-tech Feed Industry. The technologies are mostly imported from Europe and USA and a few from China. Almost 93-95 per cent poultry and aqua feeds are manufactured in commercial feed mills.
At present the industry is meeting the complete local demand and supplying its products at an affordable price.
The Bangladeshi Feed Industry started transforming from traditional to a modern manufacturing system since nineties. Now the industry has more than 400 feed mills- large and small, out of which 281 is registered with the Department of Livestock Services (DLS), Government of Bangladesh and 95 is registered with the Feed Industries Association Bangladesh (FIAB).
Majority of FIAB registered feed mills are modern and automated. Minimum production capacity is 5 Metric Tons (MT) and maximum capacity of 80-90 MT per hour. The present annual growth rate is approximately 12%.
The annual production is around 7.50-8.00 million metric tons in 2022. Monthly production capacity is around 0.625- 0.67 million metric tons. The annual demand for poultry feed in Bangladesh at present is almost similar to the gross production of around 8 million metric tons.
The Feed Industry has created around one Lakh (0.1 million) job opportunities (direct & indirect) in Bangladesh. Around 30,000 semi-skilled and general workers and 3,000 skilled workers and professionals are in regular business.
Nevertheless to say that the Feed Industry of Bangladesh maintains high standards & quality, and ensures a 'multi check-ups' before marketing its products.
Almost all the large commercial feed mills in Bangladesh have their own Testing Laboratories. These Labs are well-equipped with modern technology and experienced resources. Every single ingredient is tested here. The ingredients, whether imported or locally collected, are not allowed to use unless it gets OK certificate from the Lab.
The Lab tests include:
- The sizes, texture, color, smell and toxicity of ingredients
- Protein and other nutrient value
- Purity of the raw materials (whether any other element is mixed)
- etc.
The finished products are checked to confirm -
- Whether cooking is ok
- Moisture is at optimum level
- Whether it is good to eat by poultry/aqua/cattle
- Whether it is good to digest
- Whether it is good for the healthy and balanced body growth
- Whether it is okay to store for specific time duration (storability).
If the finished product does not justify these criteria, it is rejected. Even if all the conditioned are fulfilled, the product awaits for Test Report from the Govt. Lab.
It should be mentioned here that in both the cases of pre & post production, the raw materials and finished products are subjected to microbial counts, salmonella & escherichia coli testing, mould count, and contamination testing. Due to all these quality checks and standardization, Bangladeshi poultry & fish feeds are scoring high at region level.
Types of Feed:
In Bangladesh Poultry, Aqua and cattle Feeds are mainly produced. The feeds are of two types:
(1) Pellet and
(2) Mash

Poultry Feed
Poultry Feed is produced targeting the :
- Broiler
- Layer
- Breeder birds; and also for the
- Day-old-chicks (DOC).
Sometimes a typical type of feed is also found in the market, which is locally named as "Broiler House Feed". The retailers of broiler chicken are the main buyers of such kind of feed which is used to feed the broiler chicken during their stay at the Selling Point.
2. Fish Feed
Both the Floating and Sinking Feeds are available in Bangladeshi market. The categories are:
i) Starter
ii) Grower, and
iii) Finisher
In Bangladesh fish feed is basically produced for :
- Pangas (pangasius) fish
- Tilapia fish
- Koi (Climbing Perch)
- Carp fish
- Cat fish (Singh mach)
And also for the Shrimp.
3. Shrimp Feed
Being a shrimp exporting country, Bangladesh has a good demand for Shrimp Feed (Sinking Feed).
The Bangladeshi manufacturers produce excellent quality of shrimp feeds for the :
- Shrimp hatcheries
- Shrimp nurseries and
- Shrimp grow out ponds.
For larval and post-larval shrimp, commercially manufactured feeds provide consistent nutrition, promote healthy growth & development, and are formulated to meet the needs of specific growth stages, and also to help alleviate water quality issues. Such quality feeds also give higher survival rates, ensure larger size, healthy & safe shrimp and better profitability.
Quality Control & Quality Assurance
To assure the quality of feeds, Bangladeshi manufacturers look seriously into the following components:
- Ingredient quality
- Process control
- Finished feed quality, and
- Control of toxic substances, including pathogenic micro-organisms.
ISO Certification
Majority of the poultry feeds available in the market are from ISO certified companies. Most of the large feed manufacturers have International Certifications on feed manufacturing including Hazard Analysis and Critical Control Points or HACCP which is a systematic preventive approach

to food safety from biological, chemical, and physical hazards in production processes.
Production & Demand
According to BPICC, the annual demand for poultry feed for the commercial broiler & layer birds was about
- 2.5 million metric tons (MT) in 2014
- 2.97 million MT in 2015
- 3.5-3.7 million MT in 2016
- 4 - 4.4 million MT in 2017
- 4.94 million MT in 2018 (upto March-April 2018)
- 6.5-7 million MT in 2021
- 7.50 - 8.00 million MT in 2022 (Expected)
It is known to everyone in poultry business that healthy poultry require a sufficient amount of protein and carbohydrates, alongwith necessary vitamins and dietary minerals. To meet this requirement, 60-70 per cent production cost of a poultry bird has to made for feed.
As the market blooms, demand for poultry meat goes up, the producers also start demanding faster weight, investing lesser time and money. Nevertheless to say that the Bangladeshi feed manufacturers have very successfully took up the challenges and could respond to the demand of the poultry farmers.
Productivity of layer & broiler
Bangladeshi farmers are now getting a 2 Kg broiler bird within 37-38 days which was around 42-45 days during the early 80's. Spring chicken weighing 1.2Kg live, yielding 900gms dressed tender chicken, can be harvested in 26-28 days. It means, the rearing time has been gradually reducing. The big companies are putting their sincere efforts to improve formulation to compete with and survive in the market. Their target is now to get the best output of a 2 Kg bird within 34-35 days, feeding the same quantity improving the nutritional value of the feed.
Like broiler, layer bird's output is also excellent ! The average annual per capita egg production is 260.
The total investment in poultry industry is more than BDT 300 billion. The lions share has been invested to the poultry industry. It can be mentioned here that the Global Commercial Feed manufacturing generates an estimated annual turnover of over USD379 billion. The world compound feed production is fast approaching an estimated 1 billion tonnes annually, according to the International Feed Industry Federation (IFIF).
Poultry Feed

* Total Annual Production : 7.50-8.00 million metic tons
* Commercial Production : 93-95%
* Local Production : 5-7%
* Annual Growth rate : 12%
Please find below a projection of the requirement of feed ingredients, produced by BPICC in November 2014.
|
Ingredients (quantity in feed) |
2014 ( Million MT) |
2015 ( Million MT) |
2020 ( Million MT) |
|
Corn/Maize (50-60%) |
1.7 - 2.0 |
1.875 - 2.251 |
3.290 - 3.948 |
|
Protein Concentrate (3-6%) |
0.1 - 0.2 |
0.112 - 0.225 |
0.197 - 0.394 |
|
Soybean (25-30%) |
0.85 - 1.0 |
0.937 - 1.125 |
1.645 - 1.974 |
|
DDGS (3-5%) |
0.1 - 0.17 |
0.112 - 0.187 |
0.197 - 0.329 |
|
Seed Oil (1-2%) |
0.034 - 0.068 |
0.037 - 0.075 |
0.065 - 0.131 |
|
DORB (3-5%) |
0.1 - 0.17 |
0.112 - 0.187 |
0.197 - 0.329 |
|
Rice polish/bran (4-6%) |
0.136 - 0.204 |
0.150 - 0.225 |
0.263 - 0.394 |
|
Limestone (1-2%) |
0.034 - 0.068 |
0.037 - 0.075 |
0.065 - 0.131 |
|
Medicine (2-2.5%) |
6.80 - 8.50 |
0.075 - 0.930 |
0.131 - 0.197 |
|
Oilseed cake (2-3%) |
0.068 - 0.120 |
0.075 - 0.112 |
0.394 |
|
Others (6%) |
0.24 |
0.225 |
0.394 |
(Feed requirement table, BPICC, November 2014)
Import dependency reduced by 70 per cent
With the emergence of a new nation, Bangladeshi poultry industry got a new pace. Homely farming transformed into a profitable business. At the beginning, the average farmers used handmade feed. But as the size of the farms and number of birds increased, demand for improved imported feed became a reality.
It's an excellent achievement by the Bangladeshi entrepreneurs that they could take control over the entire feed production with their intellect, courage and commitment to their customers. But on top, it is the Government of Bangladesh that understood and visualized the prospects and inevitability of a self-reliant poultry industry.
At present, the imported poultry and fish feed is almost nil. The 98% of the total demand is being met by the commercial local production. The rest 2% is still handmade. It should be mentioned here that along with the Bangladeshi manufacturers few foreign companies are also in business.
Though the dependency of finished poultry & fish feed is almost removed, most of the feed ingredients are still being imported for insufficient or absence of local production. These ingredients are being exported from different countries including USA, Brazil, China and India.
Concluding Remarks
The per capita consumption of chicken meat and egg is still very poor in Bangladesh but there is a positive sign as the per capita income has been increasing alongwith the living standards. Alongwith this, the countrymen have now become more conscious about their health and nutrition.
According to the Bangladesh Poultry Industries Central Council (BPICC) the present production will be almost double by 2021, suppose to the continuation government support and pro-poultry policies & regulations. However, it should be mentioned here that the 2015-16 and 2016-17 fiscal year's budget has disappointed the poultry farmers and entrepreneurs as taxes have been imposed. The poultry industry has been enjoying tax exemption facilities since the last couple of years, which the industry leaders think is vital for the expected growth, reducing protein deficiencies, import dependency and for the food security. They believe that the growth could not be achieved without the support from the government, but imposing taxes at this stage would be too early. Therefore, the government should re-consider the appeal from the poultry industry and extend the tax exemption facilities upto 2025.
List of Feed Mills in Bangladesh
- A & T Agrovet (BD) Ltd.
- Abdullah Feeds
- A G S Feed Mill
- A K Fish Feed
- A.J. Feed Ltd.
- Abdul Hakim Feed Mill
- ACI Agrovet Private Limited
- Adarsho Feed Mill
-1485232779.jpg)
- Adnan Agro Ltd.
- Advanced poultry & Fish Feeds Ltd.
- Aftab Feed Products Ltd.
- AG Agro Industries Ltd.(Gazi, Noakhali)
- Agata Feed Mills Ltd.
- Agro Bangla Feed Mills Ltd.
- Agro Feed Ltd.
- Agro Gold Feed Ltd
- Agro Industrial Trust (AIT)
- Agrotech Feeds Ltd.
- Agrovet Pharma
- Ajiron Feed Ltd
- Al Amin Feed Mill
- Alal Poultry & Fish Feed Ltd.
- Aleya Feeds Ltd.
- ALI Feed Ltd
- Al-Momen Feed Mills Ltd.
- Altimate Agro Feed Industries Ltd.
- Aman Feed Limited
- AMP Feed Mills Ltd.
- Amrit Global Bangladesh Pvt. Ltd.
- Ananya Fish Park Ltd.
- Anchore Feed Ltd
- A.P Feed
- Apt Pellet Feed Industries Ltd.
- Aristocrat Agro Ltd.
- Asia Feed Mill
- Baly Chicken Hatchery & Poultry.
- Bangla Feed Mill Ltd.
- Bay Agro Industries Ltd.
- Belgium Feeds Ltd.
- Bengal Feed & Fisheries Ltd.
- Bhuyapur Feed Ltd
- Bismillah Feed Ltd
- Biswas Poultry & Fish Feeds Ltd.
- Bns Poultry Feed (Pvt.) Ltd.
- Brac Feed Mill
- C.P Bangladesh Co. Ltd. Gazipur
- Capital Feeds Ltd.
- Chandura,Kaliakoir, Gazipur
- Choice Agro Feed Ind. Ltd.
- Chuya Agro Products Ltd.
- City Feed Products Ltd
- Creative Feed Ltd.
- Dhaka Multi Feeds Ltd.
- Eagle Feeds Ltd.
- Enam Feed Ltd
- Enam Hatchery & Feeds Ltd.
- Euro Feeds Limited
- EXCEL FEED LIMITED
- F. A. Feed Mills Ltd.
- Farazi Poultry & Fish Feed ( Classic Feed)
- Fatema Poultry Feed
- Foster Farms Ltd.
- Freedom Agro Industries ltd
- Fristhope Feeds
- Gausia Feed Mills Ltd.
- Gazipur Feeds Ltd.
- Glob Agrovet Ltd.
- Gopinathpur Agro Industries Ltd.
- Gram Bangla Poultry & Fish Feed Ltd
- Grameen Feeds Ltd.
- Green Agro
- Gudholi Feeds
- Hi-Pro Feed Mills Ltd
- Iddis Poultry Feed Mill
- INDEX FEEDS MILL LTD.
- Islam Feed Ltd.
- Isphar Poultry Feed
- JAMUNA FEEDS INDUSTRIES PVT. LTD.
- Janoni Feed Mill
- Jayson Agrovet Ltd.
- Joynal Poultry Feed
- Joypura Bazar, Dhamray, Dhaka
- Kalampur Feed Mill
- Kazi Farms Limited.
- Kelia Feed Mill
- Keshan Feed Mill
- Khan Agro Feed Products
- Khatra Feed Mill
- Kiam Feeds
- KNB Agro
- Krishibid Feed Ltd.
- Kulshum Feed Ltd.

- Lion Feeds Ltd.
- Lucky Feed Limited
- M. M. Agha Limited
- Maa Gold Feed, Joypurhat
- Mars Feed Ltd.
- Meghna Chicks & Farms Ltd.
- Misham Agro Industries Ltd.
- Modern Feed Mills (Subdarban Feed)
- Modhu Danga Feed Mill
- Mokhles Poultry Feed
- Mondal Agro Industries Ltd., Joypurhat
- Mono Feed Mills Limited
- Nahar Farmers Poultry & Fish Feed
- Naruakondal, Dhamray
- National Feed Mill Ltd.
- New Al Amin Agro Care Ltd.
- New Hope Feed Mill Bangladesh Ltd.
- Newty Bangla Ltd.
- Nice Feed Ltd
- Nilsagor Feed Mills Ltd.
- Nion Feed Ltd.
- North Egg Feed
- Nourish Poultry & Hatchery Ltd, Gazipur, Bogra
- Padma Feed & Chicks Ltd.
- Paradise Feed Mill
- Paragon Poultry Ltd.(PFL, UFL, CFL, JFL, RFL)
- PCF Feed Industries, Khulna
- Peoples Poultry & Hatchery Ltd.
- Perfect Agro Industries Ltd.
- Plante Feed Mill
- Pocha Poultry and Feeds Ltd.
- Popular Poultry & Fish Feeds Ltd.
- Poshu Poultry Feed
- Poultry Link Desh Feed
- Power Feed Ltd
- Poligon Feed Mill
- Power Fish & Poultry Feed Ltd.
- Provita Feed Ltd.
- Protein House
- Prograssive Feed
- Quality Feeds Limited
- Quick Feed Ltd.
- R. M Pharma
- R.B Agro Ltd.
- R.R.P Agro Farms
- Rafid Feed Ltd.
- Rahman Agro Industries Ltd.
- Rana Feed Ltd.
- Raya Feed Ltd.

- Renata Feed
- Rupshi Fish Feed Ltd.
- S. B Poultry & Fish Feed Mills
- Sagorika Feeds Ltd.
- Saguna Feed
- Sarna Feeds, Joypurhat
- Saudi Bangla Fish Feed Ltd
- Savar Co-Operative Poultry Feed Ltd.
- Sefat Feed Mill
- Setu Feed Mills
- SGS Feed Industries Ltd.
- Shadesh Feed & Company
- Shafique Poultry Feed
- Shahparan Agro Industries Ltd.
- Shafran agro indus.
- Shalbon Agro Ltd.
- Shawkat Feed Mill
- Shohag Poultry Feed
- Shreshtho Feed Ltd.
- Shushama Feed Limited.
- Shushomo Feed Ltd
- SMS Feeds Ltd
- Solid Feeds Ltd.
- Sonali Fish & poultry Feeds
- Spectra Hexa Feeds Ltd.
- Star Feeds Ltd.
- Uttara Food & Feeds Bangladesh Pvt.Ltd.
- Sujala Feeds
- Sukhi Feed Ltd
- Sunny Feeds Ltd.
- Supreme Agro Feeds Ltd.
- Surjavita Feed (Bhaluka) only fish feed
- Swadesh Feeds Ltd.
- Tamim Agro Industries Ltd.
- Thakurgaon Feed Mill
- Total Feed Mill Ltd.
- Tongwei Feed Mill BD. Ltd.
- Toyo Feed Ltd
- Unique Fish & Poultry Feed Mills Ltd.
- United Feeds Ltd. Fresh
- Usha Feed Ltd
- Uttara Foods & Feeds (Bangladesh) Ltd.
- Victor Feeds Ltd.
- Win Poultry Feeds Ltd.
- Zebin Fish Feed Ltd.
The Global Feed Industry

Animal feeds play a leading role in the global food industry, enabling economic production of animal proteins throughout the world. Feed is the largest and most important component to ensuring safe, abundant and affordable animal proteins.
Livestock raising and the consumption of animal products make a crucial contribution to the economic and nutritional wellbeing of millions of people around the world. Animal feeds play a leading role in the global food industry and feed is the largest and most important component to ensuring safe, abundant and affordable animal proteins.
World compound feed production is fast approaching an estimated 1 billion tonnes annually, according to the International Feed Industry Federation (IFIF). Global commercial feed manufacturing generates an estimated annual turnover of over US $400 billion. Commercial production or sale of manufactured feed products takes place in more than 130 countries and directly employs more than a quarter of a million skilled workers, technicians, managers and professionals.
The UN Food and Agricultural Organisation (FAO) estimates that the world will have to produce ca. 60% more food by 2050. However according to IFIF the animal protein production will grow even more – meats (poultry/swine/beef) will be double, as well as dairy, and fish production will be almost triple by 2050.
One of the challenges is that on top of the almost 1 billion tonnes of feed produced by the feed industry, around 300 million tonnes of feed is produced directly by on farm mixing. This poses challenges as food safety authorities do not regularly audit mixing by farmers and regulatory authorities only inspect when there is a problem. According to IFIF, it is vital for the feed industry and for the sustainability of the whole feed and food chain that clear standards apply throughout the whole feed chain. IFIF suggests that both the industrial and on farm mixers should be controlled and inspected on a regular basis.
Alltech Global Feed Survey-2018
2018 Alltech Global Feed Survey estimates world feed production in excess of 1 billion metric tons for second consecutive year. The 7th annual survey features expanded data from 144 countries and more than 30,000 feed mills:
China and the U.S. produce one-third of the global feed supply
[LEXINGTON, Ky.] – The 2018 Alltech Global Feed Survey, released today, estimates that international feed tonnage has exceeded 1 billion metric tons for the second consecutive year, with a total of 1.07 billion metric tons of feed produced in 2017. The growth seen in 2017 was strong at 2.57 percent over last year. The feed industry, valued at $430 billion, has seen 13 percent growth over the past five years, equating to an average of 2.49 percent per annum. This substantial growth is supported by the higher reported consumption of meat, milk and eggs.
The seventh edition of the annual survey is the most comprehensive ever, now covering 144 countries and more than 30,000 feed mills. The results show that China and the U.S. remain the top two countries, producing one-third of all animal feed, and that predominant growth came from the pig, broiler and dairy feed sectors as well as the European and Asia-Pacific regions.
“Now in its seventh year of analysis, the Alltech Global Feed Survey continues to serve as a valuable report on the state of the global feed industry,” said Aidan Connolly, chief innovation officer and vice president of corporate accounts at Alltech. “In addition to its insights into the feed industry, it serves as a barometer for agriculture as a whole and oftentimes demonstrates the economic strength of the countries included in the survey.”
The Alltech Global Feed Survey assesses compound feed production and prices through information collected by Alltech’s global sales team and in partnership with local feed associations in the last quarter of 2017. It is intended to serve as an information resource for policymakers, decision-makers and industry stakeholders.
The top seven feed-producing countries in 2017, in order of production output importance, were China, the U.S., Brazil, Russia, Mexico, India and Spain. These countries contain approximately 54 percent of the world’s feed mills and account for 53 percent of total production. These countries can be viewed as an indicator of the trends in agriculture.
7 insights from Alltech’s 7th Annual Global Feed Survey
Last year’s Alltech Global Feed Survey crossed the threshold of one billion metric tons of feed produced globally for the first time. This year affirmed that position with an estimate of 1.068 billion metric tons.
Now in its seventh year of analysis, the Global Feed Survey continues to serve as a valuable report on the state of the global feed industry. In addition to its insights into the feed industry, it serves as a barometer for agriculture as a whole and demonstrates the economic strength of the countries included in the survey.
So what lessons can we draw from the 2018 Alltech Global Feed Survey? I have identified seven highlights representing the key trends for agribusiness leaders — from small dairy farmers in India to the largest pig producers in China.
Seven findings from Alltech Global Feed Survey #7:
1. China – The bull takes a small step back
Since Alltech’s first survey in 2011, China has been identified as the clear leader in global feed production. This year, a small decline in overall animal feed production was seen in China, but registered at less than 0.4% of the total. For a country with a growing population such a decline in animal feed production might raise an eyebrow. What does this indicate?
China’s dairy and beef feed production both declined by 17%. China’s dairy industry is struggling as milk farmers try to balance high priced inputs with poor returns from milk processors. The beef industry’s decline indicates the displacement of local production with both cheaper imports and higher quality imported meats.
China’s layer and broiler industries also saw small declines of 11% and 5% in feed production, respectively. While the poultry industry as a whole is seeing improved efficiencies due to increased industrialization, the layer industry has seen relatively rapid consolidation of the world’s largest egg market. Consumption of commercial "white" broilers has stagnated and prices have been poor.
One sector in China that has rebounded is pig feed production, increasing 11% this past year, as China’s rationalization toward larger and more professional farms reaps rewards in cost-efficient pork production.
Discover more: Fill out the form below to view the recorded webinar, download a booklet of results and explore an interactive map.
We had some trouble loading this form. Click here to continue.
2. Russia leaps upward
survey saw large increases in Russia’s overall feed production as the country grows increasingly self-sufficient and less reliant on imported meat, milk and eggs. This focus on food independence has bumped Russia’s position in the top ten from number 7 to number 4 in the feed league, pushing India, Mexico and Spain each down a position, despite the respective feed production increases of each of these countries in 2017.
All species saw an increase in feed production in Russia, with the exception of minor poultry species. The primary reported growth was for pig, dairy and beef feeds. Swine feeds, in particular, were higher as more accurate data collection allowed better estimates. To some extent dairy and beef feed production reflect more precise calculations, but also difficulty in importation, particularly regarding the beef industry. The layer and broiler feed production increased also but to a lesser extent, at 12% and 3% respectively.
3. India continues to ignite
Much like China, India has been the country to watch. Its estimated 2017 feed production grew by 9%, and this growth is expected to continue with its booming population.
Unlike China, however, cultural and religious affiliations play a bigger part inhibiting the production of livestock such as pork and especially beef. The growth of India’s feed production will be primarily to support milk, egg and chicken farmers. India’s dairy and layer feed production each increased by 5% in 2017, and its broiler feed production increased by 12%.
Despite a small decline in overall global aqua production, and particularly in the overall Asia Pacific region, India was one of the few countries that grew by 8%. Today India produces shrimp, prawns, carp and catfish for both domestic consumption and export.
4. Africa still on the fast track
For nearly every year of the Alltech Feed Survey, Africa has been one of the fastest growing feed markets. Although 2017 didn’t continue this trend as a regional average, Africa’s growth rate over the last five years was nearly 30%, which well exceeds the global average estimated at 13.1%. African pig feed production was up over 6%. Dairy, layer and broiler feed production all showed increases this year also. In fact, Africa was the fastest growing region for dairy and broiler feed production. The downward trends were seen in beef and aquaculture.
Smaller countries such as Botswana, Uganda and Mozambique led the growth but the survey showed good growth for pigs, dairy, layer and broiler feeds in larger countries such as Algeria (with the obvious exception of pigs). Beef feed production decreases were reflected in countries such as Zambia and Morocco. While many African nations showed a small increase in aquaculture production feed production, the region as a whole was down primarily because of lower reported feed production in Egypt, which has now been surpassed by Nigeria.
On average, the region has the most expensive feed costs for pigs, layers and broilers.
5. Aqua treads water
Aquaculture feed growth was relatively flat, but this number can be deceiving. A growing global population, increased desire to consume fish because of reported health benefits and a need to produce farmed fish more sustainably and economically, should have resulted in strong growth but Asia feed production weighs disproportionately, representing nearly 70% of overall global fish feed production. Africa and North America were relatively flat but we saw strong growth in Europe, Latin America and the Middle East. The decrease in the Asia-Pacific region emanates primarily from China, where aquaculture feed production decreased 5%, significant for a country that is the leader in terms of aquaculture production and produces as much as five times more than the second strongest producer. Vietnam also reported a decrease of about 9%. Indonesia fell 17% as did Taiwan and Japan, each reporting drops of 9% and 3%, respectively.
These trends have been in progress over several years and reflect disease outbreaks, particularly in shrimp, and a growing consolidation of the industry into fewer larger and more sophisticated farms. Several smaller markets grew significantly including Brazil, Chile and Peru, and the Middle East, led by Iran. Africa could have grown also but the region’s leading country, Egypt, saw a drop in production.
6. Equine races ahead
The equine industry has seen a healthy growth in the last year with every region reporting growth. North America and Africa reported the least change at 1% and 2%, respectively, but regions such as Latin America and Asia Pacific both showed healthy growth of 108,000 metric tons and 160,000 metric tons respectively. Generally, this is the result of incremental growth in many countries in both of these regions including Peru, Brazil and Mexico in Latin America and South Korea, China and Australia in the Asia-Pacific region.
The Middle East reported a growth of 22% or about 25,000 metric tons. Much of the growth stemmed from the United Arab Emirates and Saudi Arabia. This region is difficult to obtain information from, and the horse industry is no different; this growth may be a result of better information as well as a clearer understanding of the industry. Europe saw the largest increase both by percentage (24%) and tonnage (396,000). Several countries contributed to this incrementally, such as The Netherlands, Ireland, France and Russia.
7. Feed costs reflect food costs
There was no general direction for the feed industry costs this year. They are as variable as any other industry sector has been in the last twelve months.
From a pig perspective, costs are about 2% higher globally, and a pig finisher diet is estimated to average around $363. Pig production is up about 5.54% and indicates good growth for this sector.
The layer industry has seen very little growth overall (less than 1%) and holds its feed finisher diet costs similarly with a decrease of less than 2% at about $363. Broiler production costs for finisher diets are down 14% globally at $418, while the industry itself is showing incremental growth of just under 3%.
Regionally, several countries in Asia-Pacific have held higher prices for animal feed production including Japan, Taiwan and Indonesia. Africa also has had some high record holders, particularly Cameroon and Nigeria.
In general, feed costs are low and, for the foreseeable future, will remain that way. This is because farmers and growers have gotten better at combating disease and drought in plants. Corn, soy and wheat can all be produced at low costs and the harvests are bountiful. This lower input cost is reflected in our own food costs, which are also at an all-time low historically.
Global Feed Situation 2015
According to a latest survey by Alltech Inc. (released in 2016), the Global Feed Tonnage was 995.6 million metric tons but still not quite 1 billion. According to that survey the global animal feed production was :
2011 ---------- 871.00 million tons
2012 ---------- 954.20 million tons
2013 ---------- 960.42 million tons
2014 ---------- 980.12 million tons
2015 ---------- 995.57 million tons


Total Poultry Feed Production in 2015
463.7 million tons, up 6% over 2014.
- ✓Now 47% of total feed production, growing faster than other species, in particular reflecting growing demand for poultry meat.
- ✓Up 22% over 5 years.
Top concerns in 2015:
- ✓Antibiotic & coccidiostat free
- ✓Meat quality
- ✓Egg strength
- ✓Value added products.
USA tops in broiler feed production in the year 2015. Other countries in the Top-10 list were:
|
Country |
Quantity (Million Tons) |
| USA | 59.9 |
| China | 49.0 |
| Brazil | 30.9 |
| India | 11.6 |
| Mexico | 11.4 |
| Russia | 10.5 |
| Japan | 3.8 |
| France | 3.5 |
| Spain | 3.1 |
| Germany | 2.7 |
In the production of Layer Feed in 2015 China tops the rank.
| Country | Quantity (Million Tons) |
| China | 28.0 |
| USA | 24.7 |
| India | 9.3 |
| Japan | 6.3 |
| Brazil | 5.5 |
| Russia | 4.2 |
| Mexico | 4.1 |
| Germany | 2.2 |
| France | 1.8 |
| Spain | 1.8 |
According to that survey out of the total animal feed production, the share of poultry feed was 47%, pet 2%, aqua 4%, pigs 26%, Ruminant 20%, Horse 1% and others 1%


Top Feed Ingredients

• Cereals: Corn (76% preference)
- Wheat (21%)
- Barley (1%) and
- a mix of corn/barley (1%)
• Proteins: Soybean meal (96% preference)
- Sunflower (1%),
- rapeseed/canola (2%)
Top 10 Countries Feed Mills
| Country | # Mills |
| China | 8,550 |
| USA | 6,012 |
| Philippines | 3,000 |
| Brazil | 1,556 |
| India | 1,507 |
| Argentina | 900 |
| Spain | 820 |
| Iran | 570 |
| Canada | 500 |
| Russia | 497 |
Feed Price Highlights
Switzerland & Ecuador (top 60) have highest prices.
- ✓China feed prices are double that of other top countries. Japan is triple!
- ✓Others with high feed prices:
- Nigeria, Haiti, Cuba, Yemen, Seychelles, Armenia
- ✓Lowest poultry feed prices reported in U.S., Brazil, Russia, Canada
- ✓Lowest prices for pig feeds in U.S., Russia, Canada, Argentina
- ✓Feed prices bearing in mind market distortions reflect -
1) Prices for corn/soybeans
2) Smaller country feed prices are generally higher
2015 Feed Prices lower than previous year
Top Feed Companies in globe

Feed Price in Different Regions of the Globe:

Africa
- ✓Up 4% but a little slower than the 9% growth recorded in 2014 & 2013
- ✓Biggest manufacturer is South Africa at 11.6 MMT and Egypt at 6.0 MMT
- ✓Nigeria figures showed big growth (+67%) reflecting a stronger economy, restrictions on imports but also more accurate information.
Middle East
The Middle East declined 7% in 2014
- ✓21.4 MMT from 719 feed mills
- ✓Iran is down 24%
- ✓Still biggest contributor (9.15 million tons)
- ✓Oman (+35%) & Libya (+212%) led growth
M.E. has countries with the largest average feed mills, led by Libya, Kuwait and Oman.
The ME market is split 1/3 dairy, 1/3 broiler & 1/3 layer feed.
Europe
(incl. Russia & Turkey) fastest growing:
- ✓Up 10.3 MMT (4.5%) over last year
- ✓Largest contributors Russia (+13%), Turkey (+20%) but Belarus, Poland, Greece & Ukraine also were up more than 5%
- ✓European zones have 5,545 feed mills
- ✓Europe is the leading producer of dairy feeds & No.2 in many species.
North America
Production was up 2%
- ✓U.S. produced 173.7 million tons, up 2.5%, from 6,012 feed mills (700 fewer than in 2014)
- ✓No. of U.S. feed mills declined
- ✓Canadian feed production was stagnant
- ✓North America is the No.1 producer of feeds for cattle, turkeys, pets & horses
- ✓has the highest ratio of feed per person
Asia Pacific
- ✓Production was relatively flat
- ✓Represents 35% of the world’s feed
- ✓China leads feed producers: -2% (180 million tons in 2015)
- ✓Chinese consolidation means a smaller number of larger, more efficient farms with better feed conversions, productivity & thus less feed required
- ✓China has 8,550 feed mills: 3rd year of decline, reflecting government focus on food & feed safety
- ✓India is now No.4 producer (up 7%) but all major Asian markets grew more than 4% except Taiwan & Malaysia
- ✓Asia is the world’s No.1 region for pig, layer, broiler & aqua (50% of global production in China)
Latin America
Latin America: up 2.6% with 15% of global market
- ✓No. of feed mills declined in Brazil
- ✓Brazil manufactured 68.7 MMT from 1,556 feed mills (with about 100 fewer mills)
- ✓Growth: Argentina (11%), Bolivia (16%), & Paraguay (25%)
- ✓Latin America is the No.2 region in aqua; shrimp & salmon production predominate.
10 facts about global feed production in 2015
- ✓995.57 million metric tons: Total global feed production in 2015
- ✓$450 billion: Total global sales based on average feed prices
- ✓2 percent: The amount of total global feed production growth from 2014
- ✓7 percent: Amount of growth in production amounts for India
- ✓463.69 million metric tons: Total amount of poultry feed produced in 2015
- ✓179.93 million metric tons: Total production from China, the world’s No. 1 producer of animal feed
- ✓32,341: Total number of feed mills surveyed worldwide
- ✓14,349: Total number of feed mills surveyed in Asia
- ✓131: Number of countries from which data was gathered
- ✓4.5 percent: Amount of overall growth seen in Europe, the most of any region
(Alltech’s Global Feed Survey, http://www.wattagnet.com/articles/25703-facts-about-global-feed-production-in-2015)
Alltech Feed Survey: Trend reveals
14% increase in global feed tonnage over last five years
January 22, 2016: As global disposable income increases, consumers have developed a palate for protein, and, over the past five years, the feed industry has delivered. Results from the 2016 Global Feed Survey released today by Alltech estimates international feed tonnage now at 995.6 million metric tons, a 2 percent increase over last year and a 14 percent increase since Alltech first published Global Feed Survey results in 2011.
The analysis of five-year trends showed growth predominantly from the pig, poultry and aqua feed sectors and intensification of production in the African, Middle Eastern, Latin American and European regions.
“The feed industry is an excellent barometer of economic health and, based on our five years of data, predicts economic growth more accurately than many other indices,” said Aidan Connolly, chief innovation officer of Alltech, who headed up the initiative to conduct the survey.
The Global Feed Survey assesses the compound feed production from 131 countries through information obtained in partnership with local feed associations and Alltech’s sales team, who visit more than 32,000 feed mills annually.
The 2016 survey showed poultry feed has the leading market share and is growing faster than any other species, with 47 percent of total global feed manufactured specifically for broilers, egg layers, turkeys, duck and other fowl. This year’s survey also confirmed that corn and soybean meal are the standard feed ingredients globally.
The top 10 feed producers in the world remained the same: China, the United States, Brazil, India, Mexico, Spain, Russia, Germany, Japan and France. As a region, Europe saw the most growth, up 10.5 million tons over last year, with the largest contributions coming from Russia, Turkey, Belarus and Poland.
Down 2 percent from last year, China still holds the title of leading feed producer in Alltech’s annual Feed Survey with 179.93 million tons manufactured throughout the country’s 8,550 feed mills. However, this is the third year the world’s leader has reported a consolidation of its feed tonnage production into a smaller number of feed mills.
The number of feed mills in the United States and Brazil, the second and third largest markets, also declined. The U.S. produced 173.73 million metric tons from 6,012 feed mills (6,718 mills in 2014) and Brazil manufactured 68.7 million metric tons from 1,556 feed mills (1,698 mills in 2014).
According to Connolly, the consolidation of feed production into fewer mills is driven by many factors. “The Chinese, in particular, see a benefit of having fewer feed mills—lower cost, more efficient and easier to control from the perspective of traceability and food safety,” Connolly said.
Other notable regional and species statistics from the 2016 Feed Survey are:
Europe’s 5,545 feed mills, with Russia’s contributions, augmented their production by 4.5 percent in 2015 compared to the previous year. The Middle East demonstrated a 7 percent decrease with 21.44 million tons from the region’s 719 mills. Africa, North America and Latin America were up 4, 2 and 3 percent respectively. The Asia-Pacific region’s growth was relatively flat at 0.4 percent.
Pig feed production was down 2 percent, with 253.53 million tons. Aqua, with 35.47 million metric tons, is down 5 percent this year; although outside of China this figure seems to relate to more accurate data collection and not a specific decline, especially given that aqua has been a grower, up 19 percent overall in the past five years. Equine feed, at 8.22 million tons, declined 2 percent compared to 2014.
Poultry feed production continues to surge with a 6 percent increase, now at a total 463.69 million metric tons. Ruminant feed was also positive with 201.30 million tons, a 3 percent increase. Pets are up 4 percent at 22.59 million tons.
“Having met with groups such as the United Nations Food & Agriculture Organization (FAO) in Rome and the International Feed Industry Federation (IFIF), Alltech appreciates how difficult it is to collect and collate this data, but also how valuable it is on our journey to feed a planet with more than 9 billion people by 2050,” Connolly said. “With five years of work behind it, this is the most robust and reliable dataset on the sector available today.”
The Global Feed Survey outlines Alltech’s estimate of the world’s feed tonnage and trends and is intended to serve as open information resource for policy and decision makers and industry insiders alike.
(http://www.alltech.com/news/news-articles/2016/01/22/alltech-feed-survey-trend-reveals-14-increase-global-feed-tonnage-over)
Global feed production up 2 percent in 2015
Global feed production inched closer to 1 billion metric tons in 2015, according to Alltech’s Global Feed Survey.
Overall global feed production was up 2 percent to 995.5 million metric tons (mmt) in 2015, amounting to $450 billion in sales based on average feed prices, Alltech said in a webinar on January 22. Trends are expected to continue through 2016, with projected global feed production surpassing 1 billion metric tons.
Top 10 countries in terms of feed production
- ✓China
- ✓United States
- ✓Brazil
- ✓Mexico
- ✓India
- ✓Spain
- ✓Russia
- ✓Germany
- ✓Japan
- ✓France
India saw 7 percent growth in 2015. Overall, Europe saw the most growth, 13 percent, with the largest contributions coming from Russia, Turkey, Belarus and Poland. Production in the Middle East was up 17 percent.
“All are substantial contributors in terms of feed production globally,” said Aidan Connolly, Alltech chief innovation officer and vice president-corporate accounts, who presented the webinar. “India is fast becoming one of the major producers of feed globally.”
To conduct its survey, Alltech visits more than 32,000 feed mills in 131 countries to gather estimates on compound feed production. Data also is gathered from feed industry associations. Although there are differences in how feed is defined in various countries, the survey only looks at feed that goes through a feed mill, and does not include forages or on-farm production.
Numbers by animal feed sector
The poultry feed sector has the largest market share of all species, with 46 percent of total feed production – the growing fastest of all species. This is up 6 percent from 2014.
Pig feed production was down 2 percent, with 253.53 mmt.
Aquafeed, with 35.47 mmt, was down 5 percent. Alltech noted that, outside of China, this figure seems to relate to more accurate data collection and not a specific decline, especially given that the aquaculture sector is up 19 percent overall in the past five years.
Animal feed production reflects economic conditions
“The feed industry is a good indicator of economic health,” Connolly said.
He pointed out that, as China’s economy has struggled, its feed production has declined. China’s feed prices are about twice as much as other leading countries, which reflects government policies, Connolly said. 2015 was the third consecutive year the number of feed mills in China declined, reflecting government concerns with feed and food safety. Consolidation to fewer, more efficient farms leads to better feed conversions and productivity, and less feed required.
China, however, is still the leading feed producer worldwide, at 179.93 million metric tons from 8,550 feed mills. The U.S. produced 172.73 mmt from 6,012 feed mills, and Brazil produced 68.7 mmt from 1,556 feed mills. The number of feed mills has declined in all three countries.
Feed prices are the highest in Japan, Switzerland and Ecuador, along with Nigeria, Haiti, Cuba, Yemen, Seychelles and Armenia. Poultry feed prices are lowest in the U.S., Brazil, Russia and Canada, while pig feed prices are lowest in the U.S., Russia, Canada and Argentina. Feed prices reflect prices for corn and soybeans, and feed prices are generally higher in smaller countries, Connolly said.
(http://www.wattagnet.com/articles/25675-analysis-global-feed-production-up---percent-in--)
Size of the U.S. animal feed additives market
From 2012 to 2022, by type of product (in million U.S. dollars)
This graph shows the size of the U.S. animal feed additives market from 2012 to 2014, and projections up until 2022, by type of product. It is estimated that the North American animal feed additives market for antibiotics will grow from 700 million U.S. dollars in 2012 to 850 million dollars in 2020.
